Rainfall estimates at desired frequency (e.g., 1% annual chance or 100-year return period) and duration (e.g., 24-hour) are often required in the design of dams and other hydraulic structures, catastrophe risk modeling, environmental planning and management. One major source of such estimates for the USA is the NOAA National Weather Service. Raw data is available at 1-km resolution and comes as a huge number of GIS files.
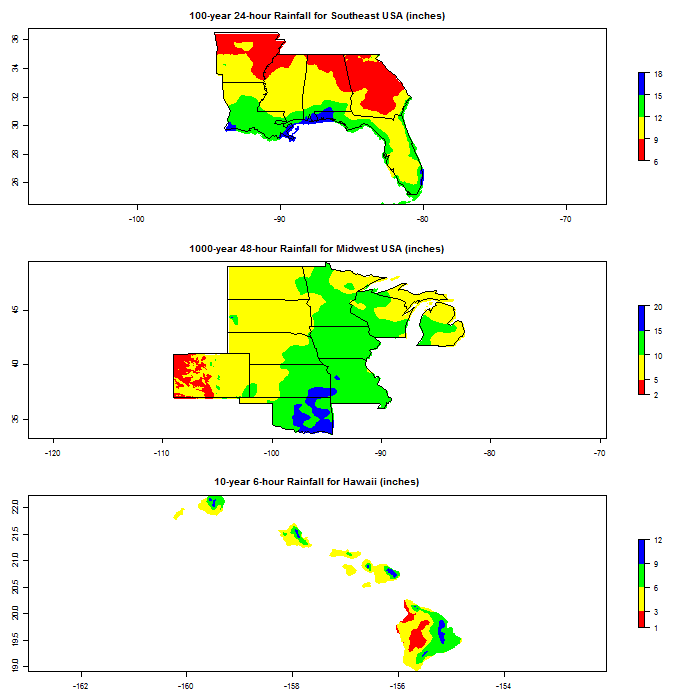
The new R package rainfreq provides functionality to easily access and analyze the 1-km GIS files provided by NWS' PF Data Server for the entire USA. This package also comes with datasets on record point rainfall measurements provided by NWS.
Here is the rainfreq package home page on CRAN. Here are some graphics from the package vignette.
A blog about data analysis using R related to natural catastrophes, insurance and climate.
Showing posts with label rainfall. Show all posts
Sunday, May 25, 2014
Wednesday, January 8, 2014
USA Drought of 2013: Analysis of High-resolution Rainfall Data Using R
The ongoing drought in California and other parts of Southwestern United States has been reported extensively by newspapers and government sites.
Although rainfall deficit is technically meteorological drought, and drought could be of several other types (such as hydrological, agricultural, etc.), the attempt here is to demonstrate the use of R in the analysis of high resolution rainfall data. Using 4-km rainfall data from the PRISM Climate Group for 1895-2013, the total for 2013 is compared with the long-term and near-term historical averages.
Spatial patterns compare well with those from the Drought Monitor from the University of Nebraska.
The entire code and all the graphics are available on GitHub - https://github.com/RationShop/rain_prism
This effort is part of The Rain Project.
Any comments or help appreciated.
Although rainfall deficit is technically meteorological drought, and drought could be of several other types (such as hydrological, agricultural, etc.), the attempt here is to demonstrate the use of R in the analysis of high resolution rainfall data. Using 4-km rainfall data from the PRISM Climate Group for 1895-2013, the total for 2013 is compared with the long-term and near-term historical averages.
Spatial patterns compare well with those from the Drought Monitor from the University of Nebraska.
The entire code and all the graphics are available on GitHub - https://github.com/RationShop/rain_prism
This effort is part of The Rain Project.
Any comments or help appreciated.
Labels:
drought,
PRISM,
R,
rain project,
rainfall,
rainfall project
Monday, January 6, 2014
The Rain Project: An R-based Open Source Analysis of Publicly Available Rainfall Data
Rainfall data used by researchers in academia and industry does not always come in the same format. Data is often in atypical formats and in extremely large number of files and there is not always guidance on how to obtain, process and visualize the data. This project attempts to resolve this issue by serving as a hub for the processing of such publicly available rainfall data using R.
The goal of this project is to reformat rainfall data from their native format to a consistent format, suitable for use in data analysis. Within this project site, each dataset is intended to have its own wiki. Eventually, an R package would be developed for each data source.
Currently R code is available to process data from three sources - Climate Prediction Center (global coverage), US Historical Climatology Network (USA coverage) and APHRODITE (Asia/Eurasia and Middle East).
The project home page is here - http://rationshop.github.io/rain_r/
If you are aware of other sources and would like to add them to this list (and/or would like to add the R code) please let me know. Any other comments or help appreciated.
Tuesday, November 26, 2013
New R package raincpc: Obtain and Analyze Global Rainfall data from the Climate Prediction Center (CPC)
The Climate Prediction Center's (CPC) daily rainfall data for the entire world, 1979 - present & 50-km resolution, is one of the few high quality and long term observation-based rainfall products. Data is available at CPC's ftp site. However, it is a lot of data and there is no software to analyze and visualize the data.
Some issues with size/format of the CPC data:
The R package `raincpc` makes life easier by providing functionality to download and process the data from CPC's ftp site. Some features of this new package are:
Here are some examples on how to obtain and visualize the data - https://github.com/RationShop/raincpc
Some issues with size/format of the CPC data:
- too many files (365/366 files per year * 34 years, separate folder for each year)
- each file has 360 rows and 720 columns
- file naming conventions have changed over time - one format prior to 2006 and couple of different formats afterwards
- file formats have changed over time - gzipped files prior to 2008 and plain binary files afterwards
- downloading multiple files simultaneously from the CPC ftp site, using wget, does not seem to work properly
- there is no software/code readily available to easily process/visualize the data
The R package `raincpc` makes life easier by providing functionality to download and process the data from CPC's ftp site. Some features of this new package are:
- Data for anytime period during 1979-present can be downloaded and processed
- Just two functions required: one to download the data (`cpc_get_rawdata`) and another to process the downloaded data (`cpc_read_rawdata`)
- Making spatial maps using the processed data is easy, via ggplot
Here are some examples on how to obtain and visualize the data - https://github.com/RationShop/raincpc
Below are the relevant CRAN and GitHub sites:
Please let me know if you find any errors or if you have any comments or suggestions.
Labels:
CPC,
daily rainfall,
global,
global rainfall,
precipitation,
R,
rainfall
Subscribe to:
Posts (Atom)


